An end-to-end churn prediction and retention analytics pipeline for mobile games, built on the real Cookie Cats A/B-test dataset (90,189 players). It goes beyond a model notebook: calibrated probabilities, bootstrap confidence intervals, an A/B causal readout, campaign break-even economics, and a Streamlit dashboard with per-player SHAP explanations — all wired together by a tested, reproducible pipeline.
Data layer loads the 90,189-player Cookie Cats dataset, defines churn as failing day-7 retention, and removes outliers before feature building.
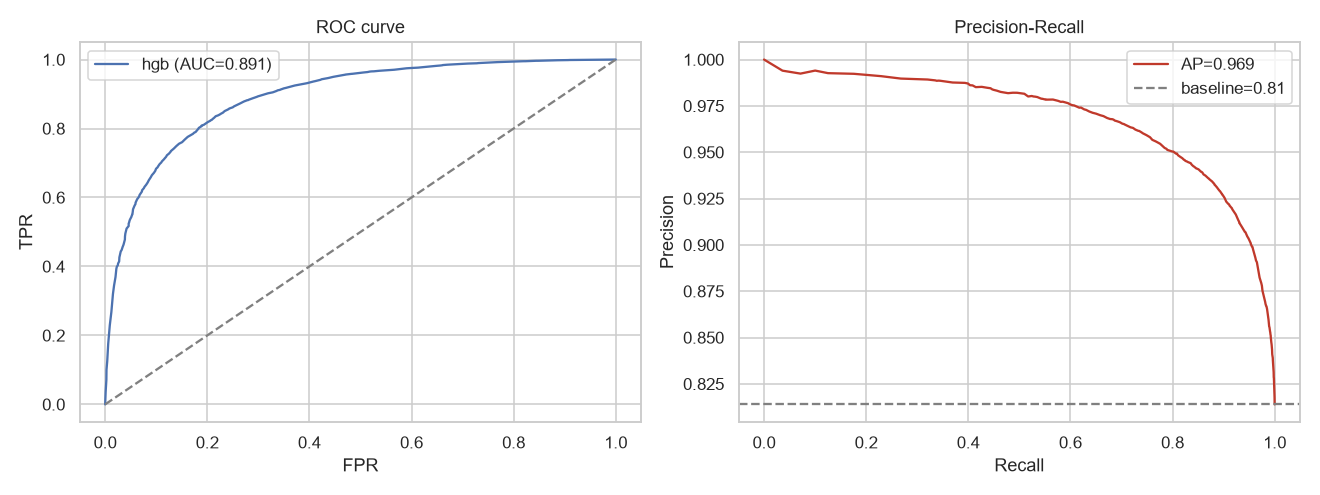
Two model tracks: a leakage-safe early-warning model (0.716 AUC from provably pre-day-7 signals) and a full enriched day-14 monitoring model, compared on the same held-out split with bootstrap CIs.
Shared modeling components (preprocessor, estimator, isotonic calibration, cross-validation, slice-AUC) guarantee train/serve parity across notebooks and the app.
A telemetry simulator generates coherent session, monetization, and progression features with a regression test guarding against label leakage.
Causal A/B analysis estimates the gate_40 treatment effect (z-test plus bootstrap CI) and campaign economics computes break-even targeting and ROI curves.
Streamlit dashboard ties it together: retention analytics, model comparison, per-player SHAP risk predictor, at-risk lists, and a campaign planner, deployed live on Render.
What I Built
Full pipeline from raw CSV to dashboard: labeling, cleaning, feature engineering, EDA, modeling, and a one-command runner (run_pipeline.py).
A leakage-safe headline model (HistGradientBoosting, ROC-AUC 0.716, 95% CI 0.708–0.723) built only from features that provably predate the day-7 label, plus a leakage ablation quantifying the 0.72 → 0.89 gap the leaky feature creates.
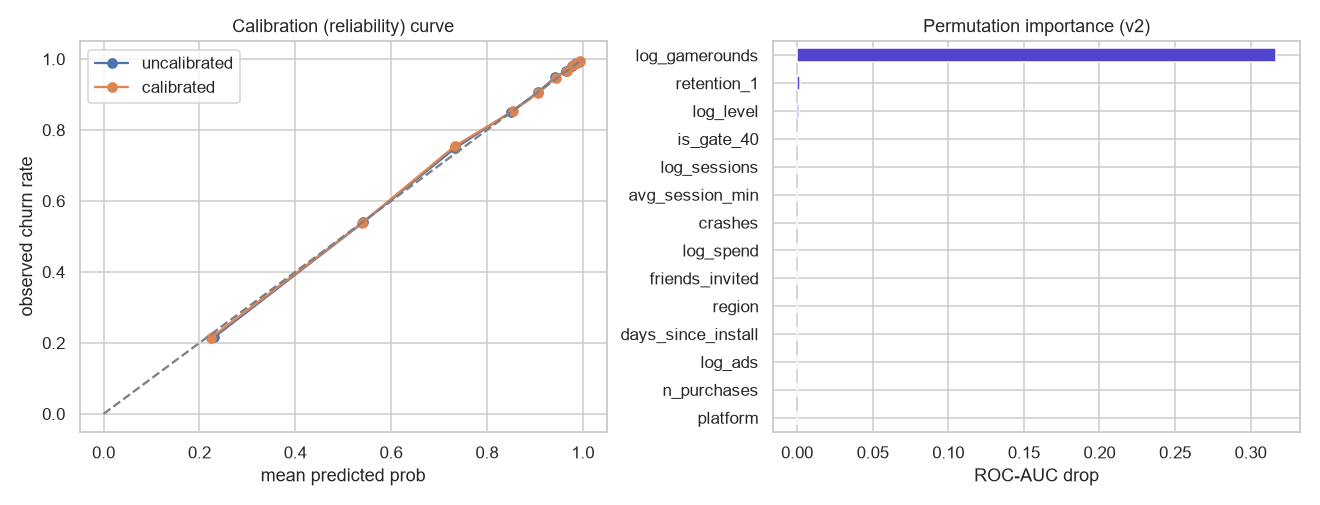
Isotonic-calibrated, cross-validated model v2 with RandomizedSearchCV tuning and bootstrap 95% CIs — calibration improved Brier from 0.107 to 0.091 on the engagement model.
A coherent telemetry simulator (sessions, monetization, progression, UX) with a regression test guarding against label leakage.
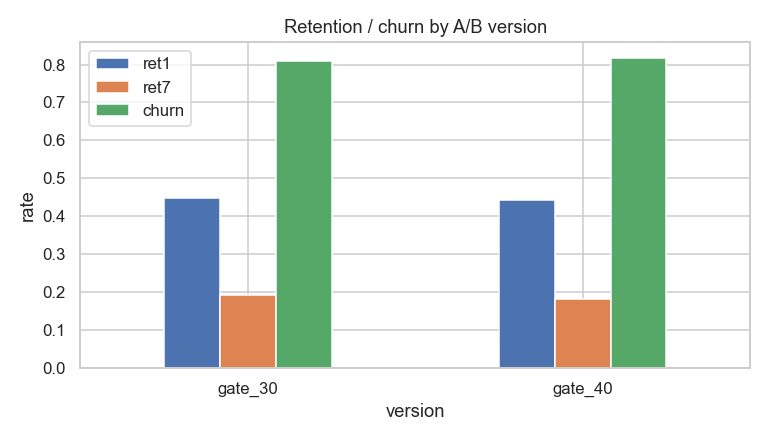
A/B causal analysis of the gate_40 experiment: ATE of −0.82pp on day-7 retention (p=0.0016) via z-test + bootstrap CI, with documentation of why CATE isn't identifiable.
Campaign economics module: break-even targeting rule (p × effectiveness × LTV > cost) and ROI curves, driven by calibrated probabilities.
Streamlit dashboard: retention + A/B readout, model comparison, risk predictor with per-player SHAP (additivity verified), at-risk list, and campaign planner.
Test suite covering label definition, cleaning, feature contracts, leakage regression, and train/serve parity; deployed live on Render.
Screenshots
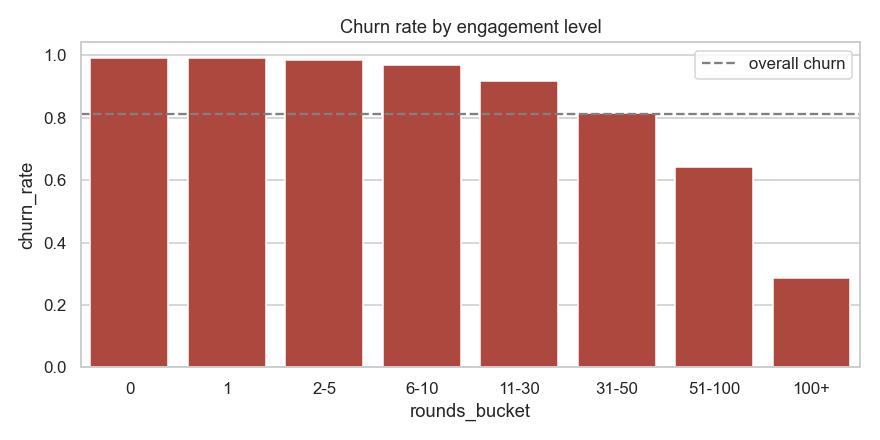
Model comparison curves — leakage-safe vs engagement-inclusive vs full enriched, on one shared test splitCookie Cats A/B test — retention by gate version (gate_30 vs gate_40)Churn rate by early-engagement segmentModel v2 diagnostics — calibration and performance after isotonic calibration and tuning
Key Decisions & Tradeoffs
Led with the honest 0.716 AUC leakage-safe number instead of the flashier 0.891 — the 14-day engagement feature partly postdates the 7-day label, so it can't be a fair predictive claim.
Chose isotonic calibration over class_weight='balanced', because class weighting distorts the probabilities the ROI tool depends on.
All model variants compared on the same held-out split with the same bootstrap seed, so headline numbers are directly comparable.
The dashboard deliberately runs the full enriched model as a day-14 monitoring view — retrospective scoring after the window closes is not leakage, and it makes SHAP explanations richer.
Business-cost decision threshold instead of a default 0.5, plus slice analysis that surfaced a real weakness (near-random AUC for zero-engagement players).
Why It Matters
It demonstrates production-grade ML judgment — temporal leakage detection, calibration, causal inference, and unit economics — on a problem where most published versions quietly report inflated numbers.
What I'd Improve Next
Replace simulated telemetry with real timestamped event logs (sessions, purchases, level completions) so engagement features can be bounded to the prediction horizon and the 14-day leakage closed properly.
Reframe churn as a survival (time-to-churn) problem to predict when players leave, not just whether.
Add MLflow experiment tracking and containerize the pipeline for reproducible, service-grade deployment.
Improve the near-random (~0.60 AUC) slice for zero-engagement players with dedicated features or a specialized model.
Collect pre-treatment covariates in future experiments so personalized uplift (CATE) becomes identifiable, enabling targeted retention offers.