A production-style gateway that sits in front of every LLM call an organization makes: per-team rate limits and budgets, automatic fallback across providers during outages, and unified observability — all behind a single OpenAI-compatible endpoint. Point any OpenAI SDK at it by changing base_url and routing, resilience, limits, and metrics happen transparently.
Async FastAPI gateway exposes a single OpenAI-compatible /v1/chat/completions endpoint; any OpenAI SDK works by changing base_url.
Distributed rate limiting via Redis token buckets (RPM and TPM) enforced atomically in a Lua script, with priority-based shedding that refuses low-priority traffic first under pressure.
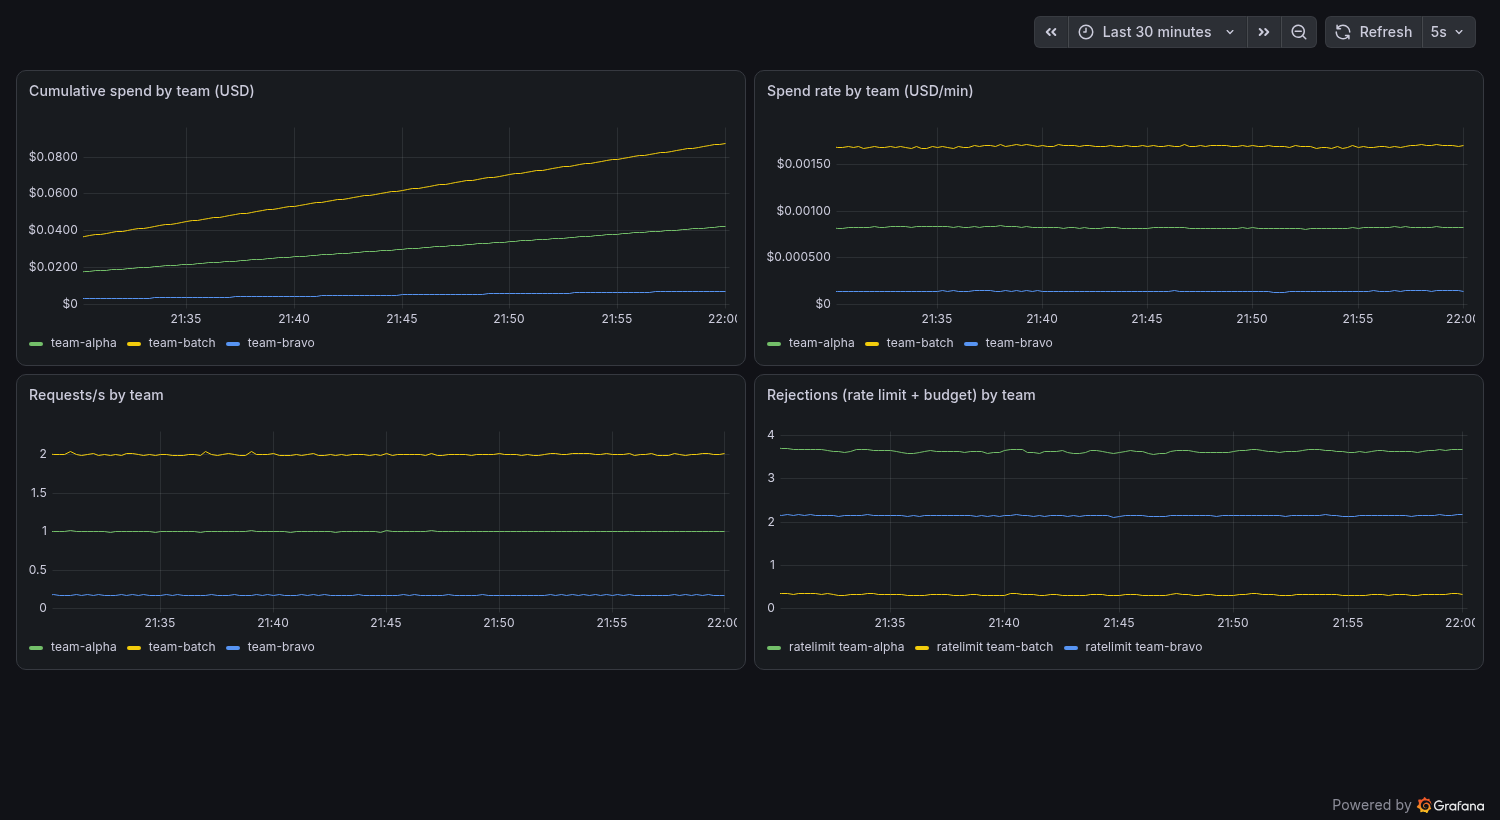
Per-team budget caps compute cost from token usage and pricing, warning at 80% and blocking at 100%; limits and budgets hold across replicas because state lives in Redis.
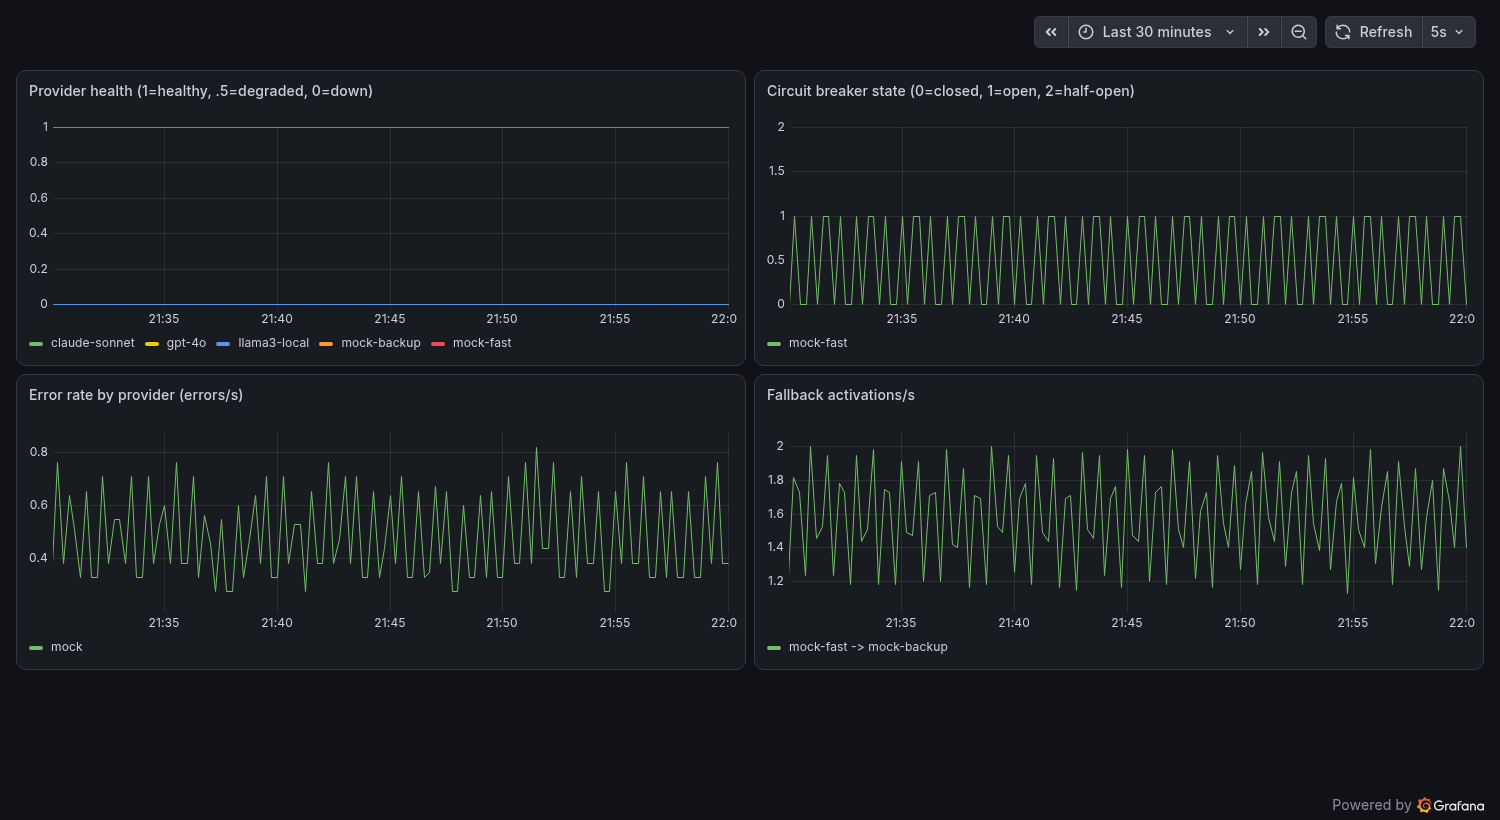
Resilience layer combines retries with backoff, per-model circuit breakers, tier-based fallback chains, and background health probes; a chaos endpoint demonstrates transparent failover.
Pluggable provider adapters (Mock, OpenAI, Anthropic, Ollama) translate the unified request per provider and normalize responses back.
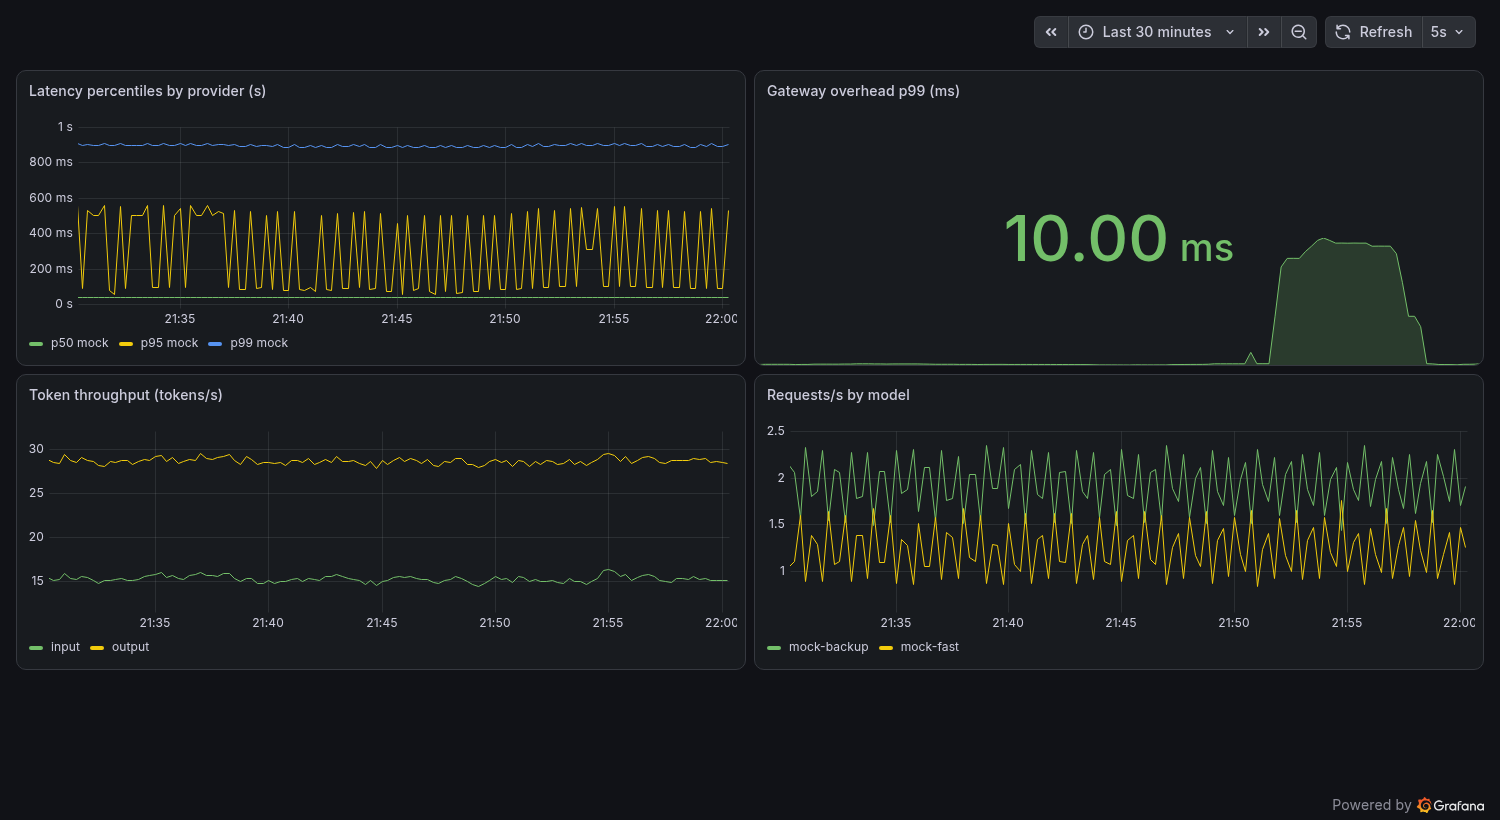
Full observability plane: Prometheus metrics on every pipeline step, three pre-provisioned Grafana dashboards (Operations, Business, Performance), alert rules, and hot-reloadable YAML config.
What I Built
OpenAI-compatible /v1/chat/completions (streaming + non-streaming) with pluggable adapters for Mock, OpenAI, Anthropic, and Ollama.
Distributed rate limiting via Redis token buckets (RPM + TPM) enforced atomically in a Lua script — measured 229 allowed vs ~230 predicted under 100-way concurrency (<0.5% error).
Priority-based shedding: low-priority teams are refused first under pressure while bucket headroom is reserved for high-priority traffic, in the same atomic Lua check.
Per-team USD budget caps computed from token usage × price — warns at 80%, blocks at 100% with HTTP 402.
Resilience layer: retries with exponential backoff, per-tier fallback chains, and per-model circuit breakers — a demonstrated trial kept every client request at 200 through a 100% provider outage and auto-recovered in 21s.
Observability: Prometheus metrics on every pipeline step, OpenTelemetry-ready tracing, three pre-provisioned Grafana dashboards (Performance / Operations / Business) plus alert rules.
Hot-reloadable YAML config (~1s, no restart) and an admin API to adjust limits/budgets live and inject chaos for demos.
Measured ~5ms median gateway overhead (p95 ~11–15ms) at 5,000 requests / concurrency 100; 20 tests at 79% coverage, weighted toward the modules that gate spend and quota.
Screenshots
Performance dashboard — latency percentiles, gateway overhead, token throughput, and RPS by modelOperations dashboard — provider health, circuit-breaker state, error rate, and fallback eventsBusiness dashboard — cumulative and per-minute spend by team, request rates, and rejections
Key Decisions & Tradeoffs
Rate limits and budgets live in Redis (shared, correct across replicas) while circuit-breaker state stays in-memory per replica for speed — a deliberate consistency/latency split.
Fail-open on Redis outage: the limiter allows traffic rather than hard-failing, because an observability dependency shouldn't take down the data plane.
Streaming falls back only before the first byte — mid-stream failover would corrupt responses, so the gateway commits once streaming starts.
Constant-time API-key comparison (hmac.compare_digest, no short-circuit team scan) so keys can't be recovered via response timing.
The Lua rate-limit script is tested against a real Lua-capable fake Redis, so the atomic check-and-consume path is genuinely exercised, not stubbed.
Why It Matters
This is the infrastructure layer every multi-team LLM org ends up needing — and it's proven with real load-test numbers and a deterministic resilience trial, not just claimed.
What I'd Improve Next
Move circuit-breaker state from per-replica memory into Redis so breaker decisions are shared across horizontally scaled instances.
Run distributed load generation against a production Redis to demonstrate horizontal scaling beyond the ~160 req/s single-laptop ceiling.
Extend test coverage to streaming paths in the provider adapters, which currently require a live upstream to exercise.
Add semantic response caching to cut cost and latency for repeated prompts across teams.
Host the Prometheus + Grafana observability plane on persistent infrastructure so dashboards are live alongside the deployed API.